This is a first post about PC chart. It covers all the functionality the chart contains, and info about using it from the code. Next posts in this series will cover the chart internals.
Feature List
1. Lines highlighting / selecting and tooltips
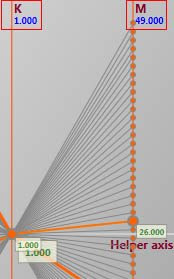 2. Diagram manipulation
Anytime you resize the window or manipulate the axes, you can fit the diagram to the current view. Simply right click anywhere on the diagram and choose "Fit To Screen" command as shown below.
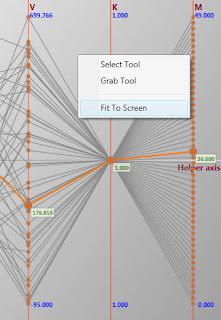 Besides, you can interact with the diagram using two tools: Select and Grab. If you pick the Select Tool (default), you can select/deselect lines, rotate/swap/move/scale axes. And if you pick the Grab Tool, you can move the diagram. Bear in mind that anytime you manipulate the diagram, you can execute the "Fit To Screen" command to return to the optimal view.
3. Axis scaling / Points Moving
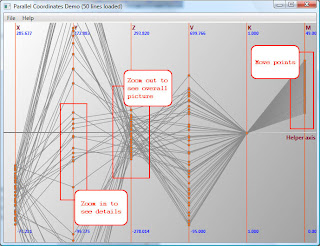 When your mouse is over any axis, you can move the points on it simply by clicking LMB and moving the mouse up and down or you can scale it using the mouse wheel. When the mouse cursor isn't over any axis, using the mouse wheel will scale all the axes. You can scale/move the helper axis as well :)
4. Axis rotating
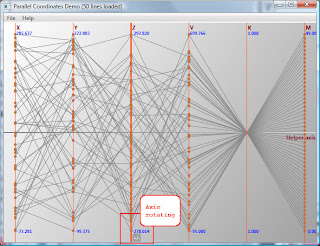 Axis rotating simply reverses the axis direction. To rotate the axis, move the mouse cursor over it and click the button that will appear at the bottom of the highlighted axis.
5. Axis swapping
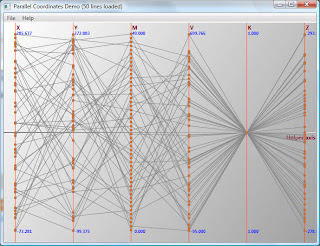
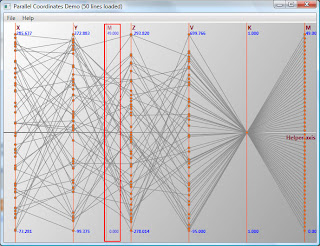 You can swap two axes by dragging the source axis (with left CTRL button pressed) and dropping it on the destination axis. After this, the source and the destination axes will swap their placements (see the picture below).
Using the PC chart
Using the chart is very straightforward. First, you need to add the Chart control. This is done in XAML like so:
<Charts:Chart DataSource="{Binding DataSource}" />
Now, you have to prepare the data. Suppose you want to visualize a collection of the following class.
All you have to do is: grab the data, create an appropriate data source, add property to axis mapping, name the labels, and that's it!
public class DemoInfo
{
public double X { get; set; }
public double Y { get; set; }
public double Z { get; set; }
public double V { get; set; }
public double K { get; set; }
public double M { get; set; }
public int Tag { get; set; }
}
Full source code is available here. Note that I use M-V-VM approach :)
public void DataBind()
{
 IList<DemoInfo> infos = new List<DemoInfo>();

 // Generate random data
 for (int i = 0; i < ObjectsCount; i++)
 {
     var x = new DemoInfo();
     x.X = m_Random.NextDouble() * 400 - 100;
     x.Y = m_Random.NextDouble() * 500 - 100;
     x.Z = m_Random.NextDouble() * 600 - 300;
     x.V = m_Random.NextDouble() * 800 - 100;
     x.K = 1.0;
     x.M = i;
     x.Tag = i + 1;

     infos.Add(x);
 }

 // Create the data source and apply mappings
 var dataSource = new MultiDimensionalDataSource<DemoInfo>(infos, 6);
 dataSource.MapDimension(0, info => info.X);
 dataSource.MapDimension(1, info => info.Y);
 dataSource.MapDimension(2, info => info.Z);
 dataSource.MapDimension(3, info => info.V);
 dataSource.MapDimension(4, info => info.K);
 dataSource.MapDimension(5, info => info.M);


 // Name the labels
 dataSource.Labels[0] = "X";
 dataSource.Labels[1] = "Y";
 dataSource.Labels[2] = "Z";
 dataSource.Labels[3] = "V";
 dataSource.Labels[4] = "K";
 dataSource.Labels[5] = "M";
 dataSource.HelperAxisLabel = "Helper axis";

 myChart.DataSource = dataSource;
}
Hope you like it!


.png)

6 comments:
Very nicely done. Thanks for your contribution!
I'm not well versed at WPF, can you tell me how you might go about modifying the code so that I can assign a color to each line? Thanks!
Would be great if you added relative-sized bubbles on each unique data point per dimension.
Hi. Your code is not available anymore for download. Could you upload it again? I have to implement parallel coordinates in C#, also using MVVM and I could use a reference code :). Thx
Hello, Your code is not available for download.
Please please please upload it again.
Nice explanation. If you are interested in software for WPF Charts, try accessing the hyperlink.
Can you Please add your code for download....
Post a Comment